Insights
Exploring Stock Beta and Profiting from Low Beta Stocks

29 March 2024
Exploring Stock Beta and Profiting from Low Beta Stocks
Introduction:
Let’s start by introducing the concept of the Beta coefficient (β) for a stock and its importance in investment analysis. Beta is a measure of the volatility of a specific stock compared to the overall market. Investors often use the Beta coefficient (β) to assess the risk and potential returns, both for individual stocks and within a portfolio.
Understanding Stock Beta:
Let’s dive deeper into how beta is calculated and interpreted.
Calculation: Beta is calculated using regression analysis, where historical returns of the stock are regressed against historical returns of the market index. The slope of the regression line represents the stock’s beta (β1).
Let`s remind the formula of simple linear regression:
Y=β0+β1X+ε
Where:
- Y is the dependent variable (the variable being predicted or explained).
- X is the independent variable (the variable used to make predictions).
- β0 is the intercept term (the value of Y when X=0).
- β1 is the slope coefficient (the change in Y for a one-unit change in X)
- ε is the error term (the difference between the observed value of Y and the value predicted by the regression line)
The formula for calculating the slope coefficient β1 in simple linear regression can also be expressed using the covariance between the independent variable X and the dependent variable Y, divided by the variance of the independent variable X. Here’s how it looks:
β1=Cov(X,Y) / Var(X)
In words:
- Cov(X,Y): This represents the covariance between the independent variable X and the dependent variable Y. Covariance measures the extent to which two variables change together. Positive covariance indicates that as one variable increases, the other tends to increase as well, while negative covariance indicates that as one variable increases, the other tends to decrease.
- Var(X): This represents the variance of the independent variable X. Variance measures the dispersion or spread of values in a dataset. It quantifies how much individual data points differ from the mean of the dataset.
Dividing the covariance by the variance of X provides a standardized measure of the relationship between X and Y, which is the slope coefficient β1 also known as the Beta.
Now we are ready to emphasize the significance of Beta and give an interpretation:
- A beta of 1 indicates that the stock moves in line with the market.
- A beta greater than 1 indicates the stock is more volatile than the market. For example, if a stock has a beta of 1.5, it’s expected to move 1.5 times more than the market.
- A beta less than 1 indicates the stock is less volatile than the market. For example, if a stock has a beta of 0.8, it’s expected to move 80% as much as the market. We have prepared for you some stock picks with a negative beta here
Usefulness: Beta helps investors assess the risk of a stock compared to the market. A high-beta stock is riskier but might offer higher returns in bullish markets, while a low-beta stock tends to be less volatile and may provide stability during market downturns.
The Case for Low Beta Stocks:
The stocks with low Beta or zero Beta have some great implications for investors:
- Stocks with negative beta tend to move in the opposite direction of the overall market.
- They can serve as a hedge against market downturns, providing portfolio diversification and stability.
- Low beta stocks might include companies in sectors such as utilities, healthcare, or consumer staples, which are less impacted by economic cycles.
Let’s highlight several stock picks with low beta, showcasing their characteristics and potential benefits for investors:

- Example 1: Consumer Staple WD-40 (Ticker: WDFC):
- Consumer Staple stocks often have negative beta due to their stable revenue streams and defensive nature. The products they produce consumers use regularly, regardless of economic conditions. These products tend to be non-cyclical, meaning demand remains relatively stable even during economic downturns.
- A strong brand name and stable cash flows make the company company’s financial health predictable and resilient to market downturns.
- Investing in WDFC with beta -0.06 can mitigate portfolio risk during market downturns while offering potential returns.
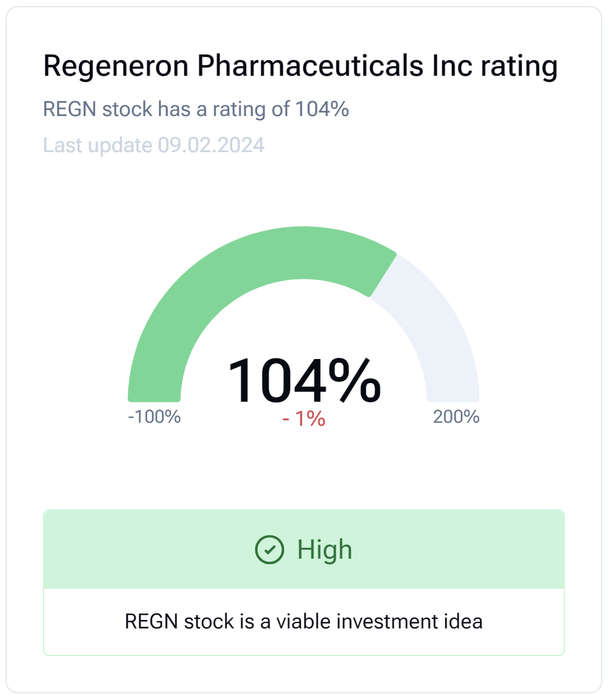
- Example 2: Healthcare Biotech Company Regeneron Pharmaceuticals INC (Ticker: REGN):
- Healthcare stocks, particularly pharmaceuticals, and biotechs, may exhibit negative beta due to their defensive nature because people require medical treatments, medications and healthcare services irrespective of economic fluctuations.
- Healthcare pipelines, patents, and regulatory approvals dictate their own specific long-term cycles, impacting companies’ operations and revenues. These factors contribute to its negative beta.
- Healthcare companies often have diversified portfolio of products on different stages of approval, offering protection against market volatility while tapping into long-term growth prospects.
- Investing in REGN with beta 0.15 can possibly contribute to the overall portfolio return adding to the portfolio only 0.15 beta.
Portfolio Beta:
To calculate the beta of a portfolio, you need to follow these steps:
- Determine the Weights: Determine the proportion of each asset in the portfolio. This is typically done by calculating the percentage of the portfolio’s total value that each asset represents.
- Calculate the Beta of Each Asset: Find the beta of each individual asset in the portfolio. You can obtain this information from financial websites like Eyestock, databases, or calculate it using historical price data and regression analysis against a market index.
- Weighted Beta Calculation: Multiply the beta of each asset by its respective weight in the portfolio. Then, sum up these values to find the portfolio’s weighted beta.
Here’s the formula for calculating the beta of a portfolio:
Portfolio Beta=∑(wi×βi)
Where:
- wi= Weight of the i-th asset in the portfolio
- βi= Beta of the i-th asset in the portfolio
For example, let’s say you have a portfolio consisting of two assets:
- Asset A: Beta = 1.2, Weight = 40%
- Asset B: Beta = 0.8, Weight = 60%
Using the formula:
Portfolio Beta=(0.4×1.2)+(0.6×0.8)
Portfolio Beta=0.48+0.48
Portfolio Beta=0.96
So, the beta of the portfolio is 0.96.
This calculated beta value represents the sensitivity of the portfolio’s returns to movements in the market index used to calculate the betas of the individual assets. A beta greater than 1 indicates that the portfolio is more volatile than the market, while a beta less than 1 suggests it’s less volatile.
Normally, an investor aims to combine assets with different betas, though an investor can construct portfolios with desired risk exposures. Assets with higher betas are expected to have higher expected returns suitable for Growth-Oriented Investors, than those assets with lower betas suitable for Conservative Investors.
A portfolio with a beta of 0 could also be part of a diversified investment strategy. By including assets with different correlations to the market, investors can reduce overall portfolio risk through diversification. In this context, a portfolio with a beta of 0 contributes to reducing the portfolio’s overall sensitivity to market movements.
The Capital Asset Pricing Model (CAPM) and Beta
The Capital Asset Pricing Model is a widely used tool in finance for estimating the expected return on an asset based on its risk. It provides a framework for determining the appropriate required rate of return for an investment, considering both the risk-free rate of return and the risk associated with the asset’s volatility compared to the overall market.
Here’s a breakdown of the components of the CAPM model and the role of beta within it:
- Expected Return Formula (CAPM Equation):
The CAPM formula is expressed as: - Expected Return=Risk-Free Rate+β×(Market Return−Risk-Free Rate)
- Risk-Free Rate: The return an investor can achieve with no risk, typically approximated by the yield on government bonds, such as U.S. Treasury bonds.
- Market Return: The expected return of the overall market, often represented by a market index like the S&P 500.
- Beta (β): Represents the systematic risk of an asset, measuring its volatility relative to the market. It reflects how much the asset’s return moves in response to changes in the market return.
Role of Beta:
- Risk Measurement: Beta quantifies the systematic risk of an asset, which is the risk that cannot be diversified away by holding a diversified portfolio. It measures how sensitive an asset’s returns are to fluctuations in the market.
- Portfolio Management: In portfolio management, beta helps investors assess and manage risk. By combining assets with different betas, investors can construct portfolios with desired levels of risk exposure. Assets with higher betas are riskier but may offer higher returns, while assets with lower betas are less volatile and provide stability.
- Expected Return Estimation: Beta is a key input in the CAPM equation for estimating the expected return of an asset. The beta coefficient determines the extent to which the asset’s return is influenced by market movements. Assets with higher betas are expected to have higher expected returns to compensate investors for their higher systematic risk.
- Investment Decision-Making: Investors use beta to make informed investment decisions. They may seek assets with betas that align with their risk preferences and investment objectives. For example, investors with a higher risk tolerance may favor assets with higher betas, while more conservative investors may prefer assets with lower betas or even negative betas for diversification purposes.
Overall, the CAPM model and the use of beta provide a structured approach for assessing risk and determining expected returns in financial markets, aiding investors in making informed investment decisions. However, it’s important to note that CAPM has its limitations and assumptions, and investors should consider other factors and models in conjunction with CAPM when making investment decisions.
Conclusion:
To sum up, it is highly important to understand stock beta. Investors use beta to make informed decisions. They may seek assets with betas that align with their risk preferences and investment objectives. For example, investors with a higher risk tolerance may favor assets with higher betas, while more conservative investors may prefer assets with lower betas or even negative betas for diversification purposes.
We encourage readers to conduct further research on stock betas with Eyestock.
Read also
What Should Be Considered About The Stock Before The Purchase?
08 Aug 2024
Fair Value As A Basis For Investment Decision Making
18 Jul 2024
ASML: Semiconductor Manufacturing Equipment Leader
13 Mar 2024
Publicly Traded Football Clubs
22 Mar 2024
Bayer Stock Analysis
28 May 2024
Tesla-Navigating the Future
23 Apr 2024
Insights
Your source for expert analysis and investment ideas based on Eyestock Ratings and Valuations